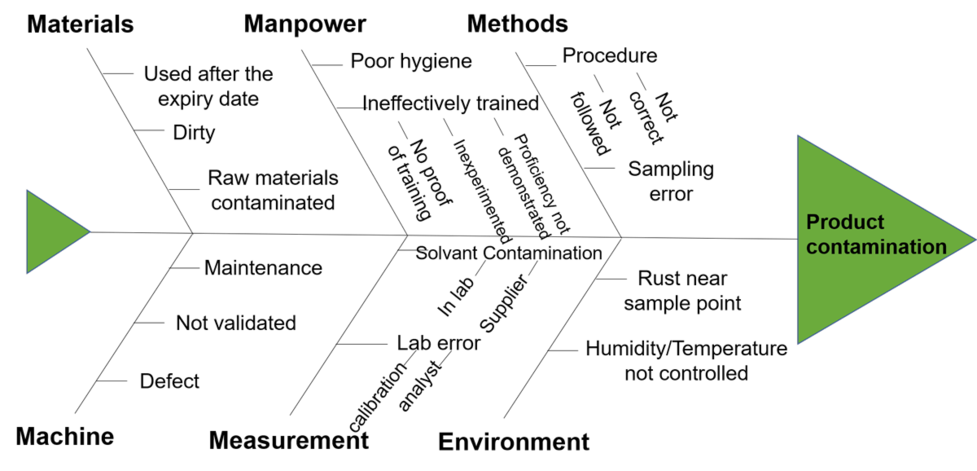
The right side of the diagram or “the head of the fish” lists the effect/the problem. The effect is written as the problem statement for which you are trying to identify the causes. The left side of the diagram or “the bones of the fish” is where the possible contributing causes/factors are listed.
How to create an Ishikawa diagram?
A cause and effect diagram can be created in six steps:
- Create your team: Include team members who know the processes and systems involved in the problem or event investigated. Define one facilitator, who will be in charge of collecting the ideas for the fishbone completion.
- Agree on the problem statement (the effect): The problem definition is written at the mouth of the “fish.” Be as clear and specific as you can about the problem. Make sure that all the members of the brainstorming understand it and have the same interpretation of the problem definition.
In the example above the problem is a product contamination.
- Agree on the major categories of the problem causes: The major categories are written as branches from the main arrow. The typical categories are:
- Machine (equipment): causes are in equipment, such as machinery, computers, tools, instruments, technology
- Method (process): causes are in the rules, regulations, laws or standards
- Material: causes are in defect or material properties
- Manpower (people): causes are in humans, people
- Measurement/Medium: including weather, terrain, obstructions, lighting
- Add root causes: Brainstorm all the possible causes of the problem. Ask “Why does this happen?” As each idea is given, the facilitator writes the causal factor as a branch from the appropriate category. Causes can be written in several places if they relate to several categories.
In the example above for the category “Manpower”, one possible root cause is: Ineffectively trained.
- Add root sub-causes (determine deeper causes): Again ask “Why does this happen?” about each cause. Write sub-causes branching off the cause categories. Keep asking “Why?” and generate deeper levels of causes and continue organizing them under related causes.
For the cause “Ineffectively trained”, a sub-cause can be: proficiency not demonstrated.
- Identify Root Causes: There are usually many contributors to a problem, so an effective fishbone diagram should have many potential causes listed in categories and sub-categories. To determine the ones most likely responsible for the problem:
- Look for causes that appear repeatedly
- Or consider a multi-voting technique such as having each team member identify the top three root causes. Ask each team member to place three tally marks or colored sticky dots on the fishbone next to what they believe are the root causes that could potentially be addressed. The most likely causes will have the most dots.
The training of the personnel shows up under manpower (ineffectively trained) and procedure (not followed).
Conclusion
By exploiting the combined knowledge and experience of a group of people, the Ishikawa diagram helps identify cause and effect relationships in problems. Without such a visual analysis, a team may waste time brainstorming solutions to what they assume is the problem, when in fact it may only be a symptom. In other words, they may end up solving the wrong problem. Another advantage is that the Ishikawa diagram allows to see all causes simultaneously and therefore represents an useful tool for presenting the problem and solutions to stakeholders
